NEWS: Tracktable 1.5.0 is released, 3 April 2021
This update is focused on improvements to the documentation. We have overhauled the Python and C++ user guides, cleaned up API documentation, reorganized C++ and Python examples, and included all of our Jupyter notebooks in the documentation. There’s a lot more work to do — isn’t there always? — but we believe what’s there is in much better shape than it was.
There are a few minor bug fixes to the library. As usual, see the Release Notes for details. Source code, binary install packages and documentation are all available from the main Downloads page. As with previous releases, you can install Tracktable with pip install tracktable
or upgrade an existing installation with pip install --upgrade tracktable
.
NEWS: Tracktable 1.4.1 is released, 3 December 2021
This is a bugfix release. We identified a significant regression in our use of Matplotlib + Cartopy that would cause still-image maps to error out during rendering. There are also fair number of improvements to the documentation. If you use Tracktable from C++, be sure to look at the release notes (linked below) for an update on the C++ readers and writers before you upgrade.
Details are available in the Release Notes. As usual, source code, binary install packages and documentation are all available from the main Downloads page. As with previous releases, you can install Tracktable with pip install tracktable
or upgrade an existing installation with pip install --upgrade tracktable
.
NEWS: Tracktable 1.4.0 is released, 20 October 2020
This is a feature release. The major update is ECEF coordinates, a useful way to represent points around and above the globe in a 3D Cartesian space. Interactive trajectory rendering is still in beta. Its current API will remain available through at least 1.6.0. We hope to clean up the rendering API in general between now and then.
Details are available in the Release Notes. As usual, source code, binary install packages and documentation are all available from the main Downloads page. As with previous releases, you can install Tracktable with pip install tracktable
or upgrade an existing installation with pip install --upgrade tracktable
.
NEWS: Tracktable wins an R&D 100 award! (1 October 2020)

This year we entered Tracktable in the R&D 100 competition in the Software and Services category. These awards highlight the most innovative, revolutionary and impactful developments in research and product development every year. We are thrilled to announce that we won!
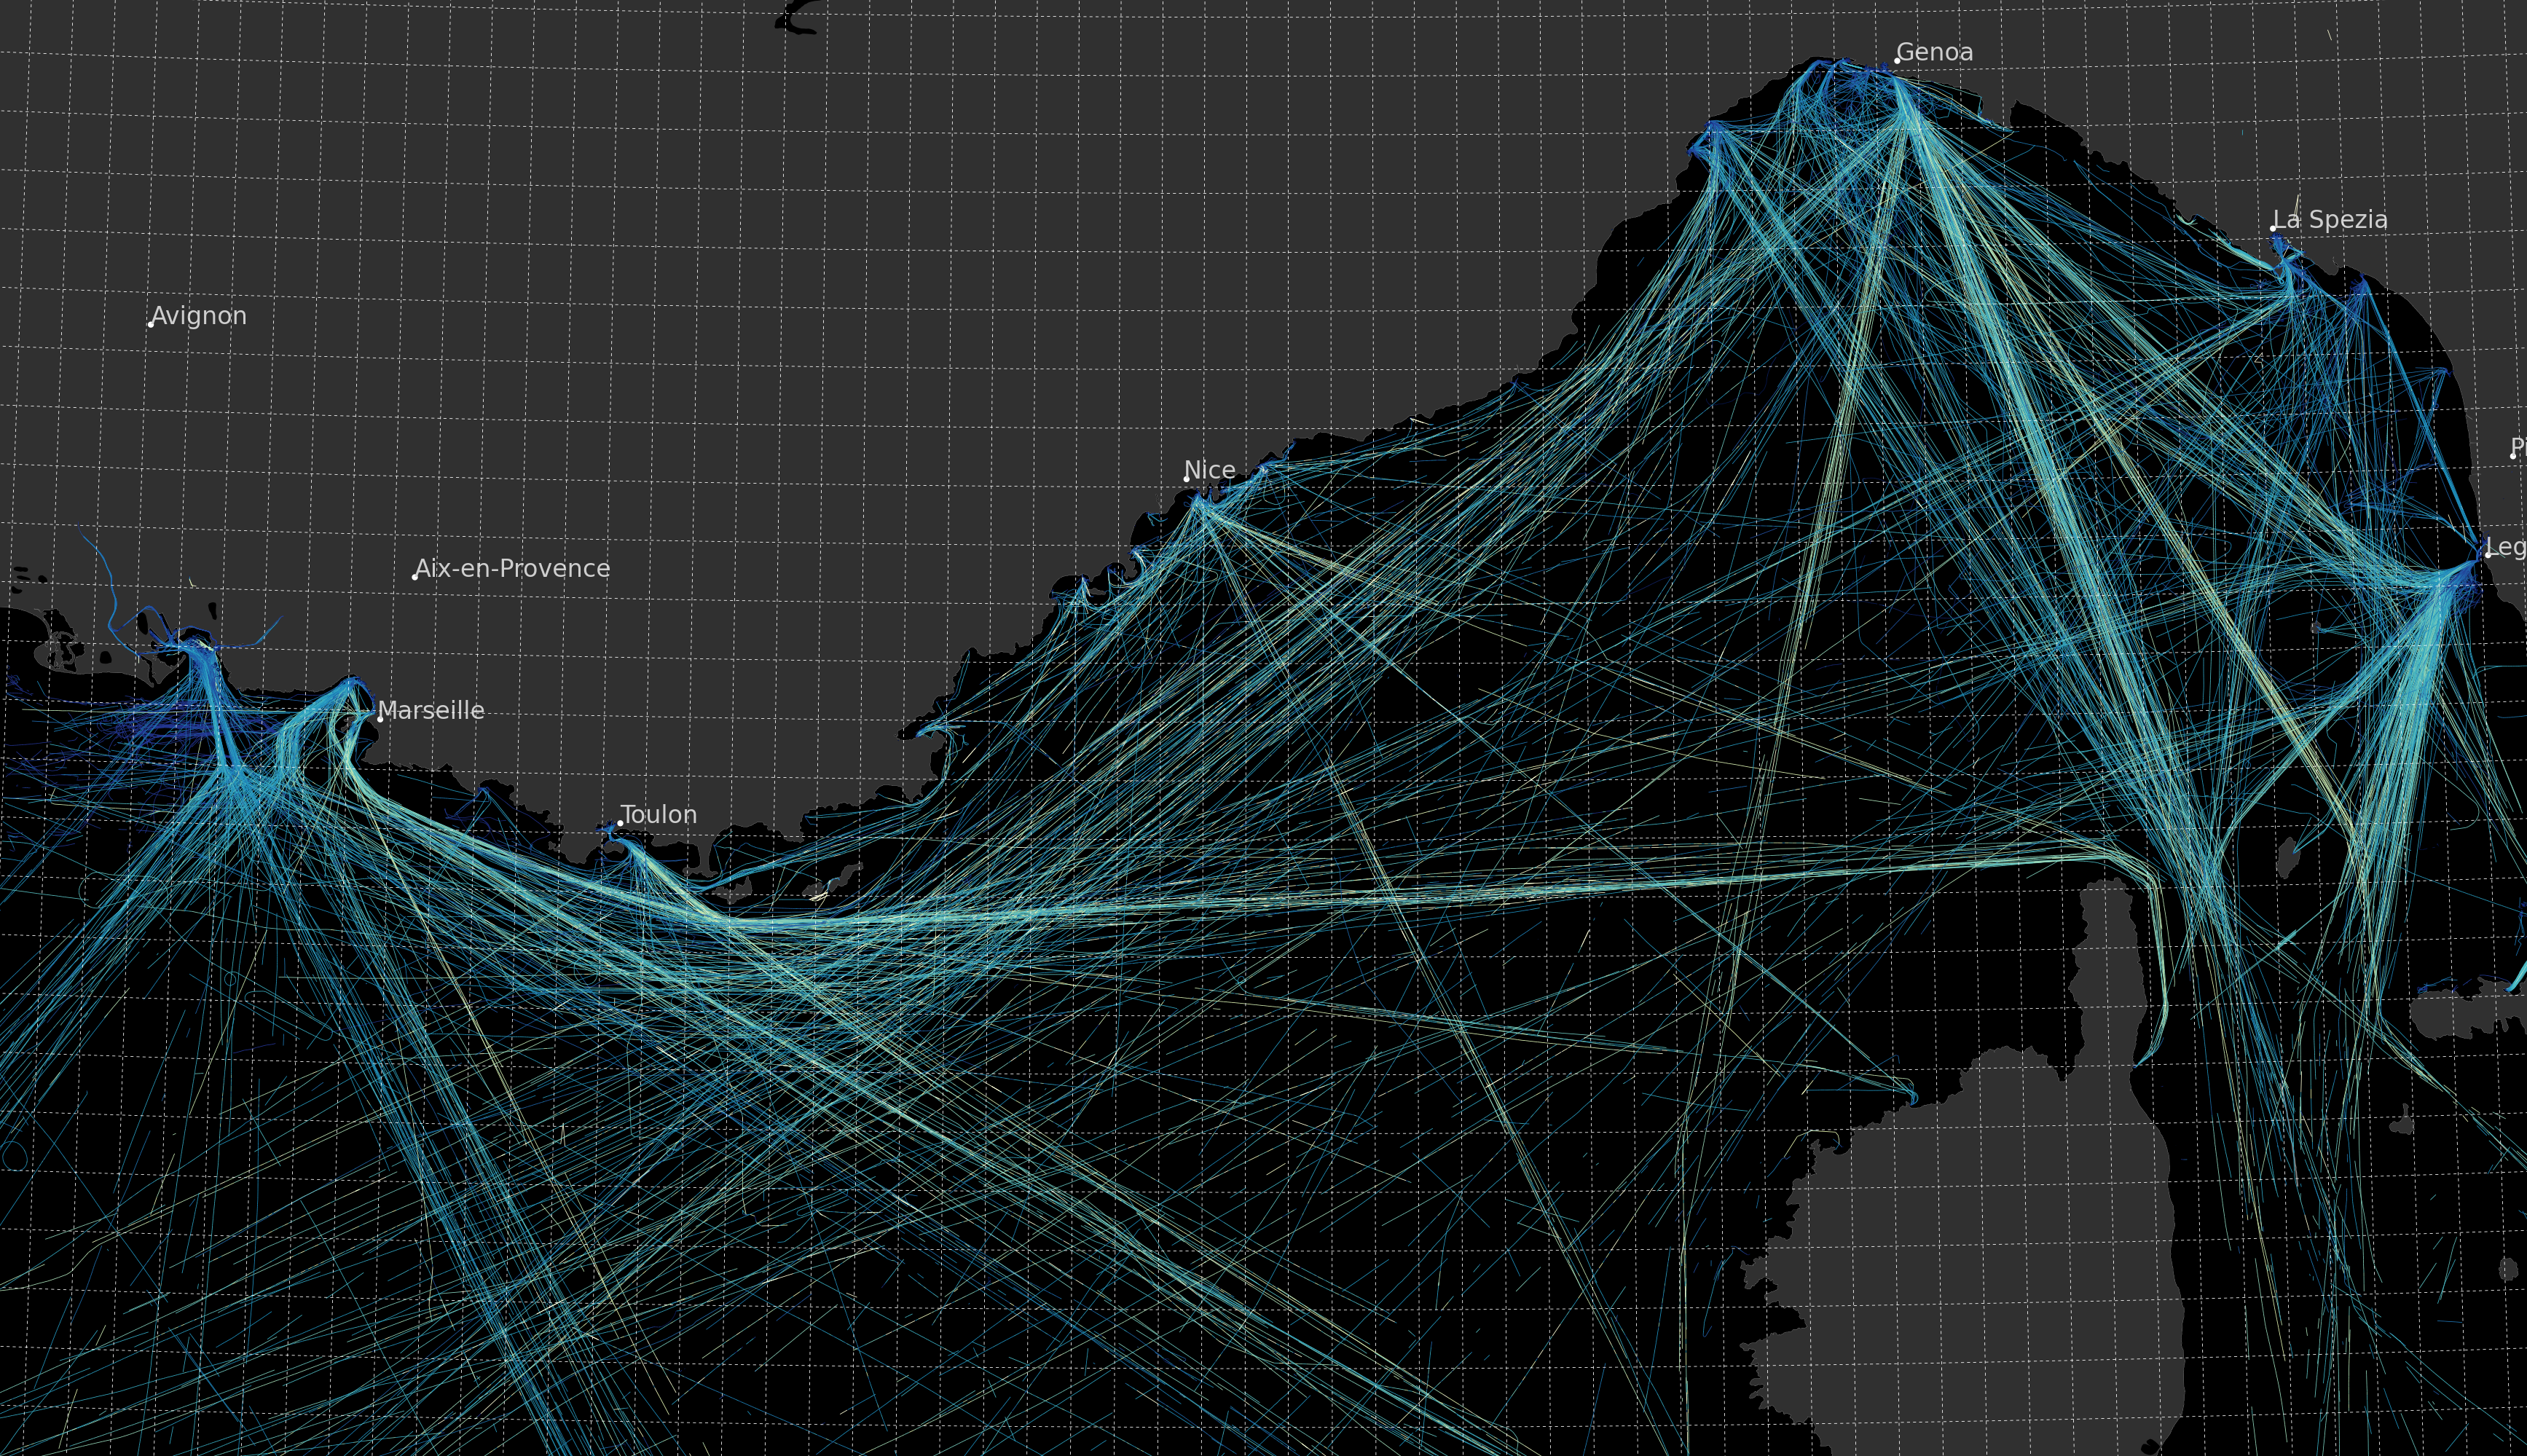
In addition to the honor of being chosen for the award, we are delighted to note that the home page for R&D World Online is currently dominated by an image created using Tracktable.
Our contest submission video is available on YouTube. It’s a short discussion of what Tracktable is for and why (in our opinion) it’s awesome. As always, if you have questions, please use the Contact Us page to get in touch.
NEWS: Tracktable 1.3.1 released, 22 July 2020
This is a patch release. There are some new features being launched in beta (notably interactive trajectory rendering; see the Release Notes for detail) that will have their APIs tweaked between now and their official release in 1.4.0.
As usual,source code, binary install packages and documentation are all available from the main Downloads page. As with previous releases, you can install Tracktable with pip install tracktable
or upgrade an existing installation with pip install --upgrade tracktable
.
NEWS: Tracktable 1.3.0 released, 27 May 2020
This is a feature release! We’ve added distance geometry and ECEF (Earth Centered Earth Facing) coordinates as well as a host of minor features and bugfixes.
Source code, binary install packages and documentation are all available from the main Downloads page. As with previous releases, you can install Tracktable with pip install tracktable
or upgrade an existing installation with pip install --upgrade tracktable
.
NEWS: Tracktable 1.2.4 released, 23 January 2020
An alert user spotted a problem with trajectory rendering. It warranted an immediate bugfix release instead of waiting for more changes to pile up. There are no new features in this version.
Source code and binary install packages are on the Downloads page as usual. If you’ve installed Tracktable via pip
you can upgrade with pip install --upgrade tracktable
.
NEWS: Tracktable 1.2.3 released, 21 January 2020
Tracktable 1.2.3 is released. This is a bugfix release. There was a bug that prevented tracktable.geomath.compute_bounding_box()
from working on trajectories that had been restored from pickle files. Other (mainly cosmetic) bug fixes are listed in the release notes.
Source code and binary install packages are on the Downloads page as usual. If you’ve installed Tracktable via pip
you can upgrade with pip install --upgrade tracktable
.
NEWS: Tracktable 1.2.2 released, 14 January 2020
Tracktable 1.2.2 is released. This version includes a few quality-of-life upgrades such as vastly reducing logging spam. Source code and binary install packages are on the Downloads page as usual. If you’ve installed Tracktable via pip
you can upgrade with pip install --upgrade tracktable
.
NEWS: Hello, Boilermakers!
We’ve put together a development release of Tracktable, some sample Jupyter notebooks, and some sample data. You’ll find them on the Purdue Data Mine page.
Expect the notebooks and the sample data to be updated over the next week as we add more capability. While you’re at it, please subscribe to the announcements mailing list (see the How to Contribute page) for notifications as soon as things become available!
Tracktable is a cross-platform library for analysis and visualization of the trajectories of moving objects. A moving object can be almost anything from a whale to an airplane to a cruise ship to the point on a screen where a user is looking. In other words, a moving object can be almost anything for which you have a unique ID and a series of coordinates with time stamps.
Our main vehicle for analysis is the feature vector: a collection of numbers that each describe some aspect of a trajectory. We make it easy to create feature vectors for a collection of trajectories, whether using pre-defined features or those of your own devising. Once you have a collection of feature vectors you can apply machine learning algorithms like clustering, similarity computation, range and nearest-neighbor queries — plus anything else you have in your bag of tricks!
Tracktable Gallery

Atlanta Air Traffic

Sea lanes from Helsinki to Tallinn

World Heat Map

Albuquerque Air Traffic

Singapore Maritime Traffic Map
Tracktable has built-in support for rendering still images with Cartopy. It can also render movies if you have FFmpeg (https://ffmpeg.org) installed. There is example code included for writing out KML files for Google Earth and friends. We are working on adding support for interactive mapping toolkits like Bokeh and Folium.
Tracktable is written in Python and C++ and runs on Windows (via Visual Studio), Mac OS X and Linux. All of the library’s capabilities are available in Python and most in C++. We envision Jupyter notebooks as the preferred interface for working with the toolkit and will release a complete set of Jupyter examples with version 1.3 of the toolkit.
We distribute Tracktable under a three-clause BSD open source license. Check out the license text for the details.